PSHS Internship 2023: Difference between revisions
Jump to navigation
Jump to search
No edit summary |
No edit summary |
||
| (7 intermediate revisions by the same user not shown) | |||
| Line 1: | Line 1: | ||
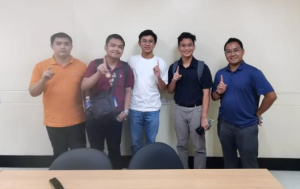
[[File:Day 1 Picture.png|thumb|From Left to Right: Allen Tan (CIDR P3), Randolf Dela Cruz, Quentin Pison, Raph Racho, Lawrence Quizon (CIDR P3)]] | |||
Main page for distributing resource for and documenting the internship. | Main page for distributing resource for and documenting the internship. | ||
| Line 8: | Line 9: | ||
** 2000 more pictures sorted by Friday | ** 2000 more pictures sorted by Friday | ||
** Finished reading up to Ch 2.3 of the tutorial. | ** Finished reading up to Ch 2.3 of the tutorial. | ||
*By Monday, 2000 more pictures. | *By Monday Jun 26, 4PM: | ||
**Euler problems. | **2000 more pictures. | ||
*By | **Euler problems all done. | ||
** | *Wed Jun 28 is a <u>holiday</u>. No meeting. | ||
**Look into matplotlib | *By Friday Jun 28, 4PM: | ||
*** | **pip install matplotlib, numpy and scipy | ||
**Look into matplotlib, numpy, scipy packages for python, show me yourself opening a picture from SPICE using matplotlib.pyplot.imshow | |||
**Questions: | |||
***What are the dimensions of the numpy representation of the image? Is it 1D, 2D, or 3D? | |||
***Try to call imshow on image[0], image[1], image[2]. What appears? What do you think image[n] returns? | |||
**Crop the 1/4 upper left, upper right, bottom left and bottom right of the image into 4 new numpy arrays. Show these images. | |||
*By Monday July 3, 4PM: | |||
**Create a github.com account, and create a repository creating the code you've made so far. | |||
*By Wed July 5, 4PM: | |||
**Download '''two''' of the folders of the [https://mega.nz/folder/LlgByZ6Z#wmLa-TQ8NYGkPrJjJ5BfQw/folder/flwFUDQB LettuceMOT dataset]. | |||
***Quentin: B&F | |||
***Randolf: O&I | |||
***Raph: Straight1 & 2 | |||
**Inside the "gt" folder, there is a text file containing a bunch of labels. These labels are the bounding boxes of lettuce in each picture in the "img" folder. Generally, the labels are structured as follows: <math>label = \{img_{id},lettuce_{id},x,y,w,h,1,1,1\}</math>, <math>x, y</math> is the lower left corner of the bounding box of the specific lettuce in the image, and <math>w, h</math> is its width and height. | |||
**Your task is to create a script that loops through each line in the "gt.txt" file and saves the corresponding cropped picture of a lettuce into a new folder named "'''cropped'''". | |||
*By Friday, 8AM: | |||
**Internship presentation (for debriefing meeting) (all three of you will be creating the same presentation- use google slides and collaborate to make one presentation about your results). | |||
**'''Forget about the CSV thing:''' Make a [https://medium.com/dejunhuang/learning-day-31-creating-your-own-image-dataset-in-pytorch-e92419d4381d Pytorch Dataset object] out of your images. See code below for sample code opening a Pytorch dataset from a folder structure. | |||
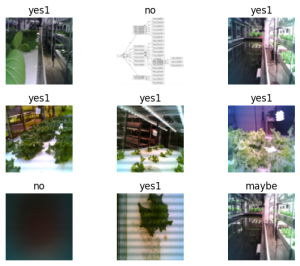
**Your last task: make a code showing a '''random image''' (use numpy.randint) from the dataset, and set the title to the corresponding label. Like the image provided here, but for only one image.[[File:Spice dataset sample.png|thumb|Make a matplotlib plot like this, but using just one image.]] | |||
== About CIDR Project 3 == | == About CIDR Project 3 == | ||
| Line 19: | Line 38: | ||
== Your tasks == | == Your tasks == | ||
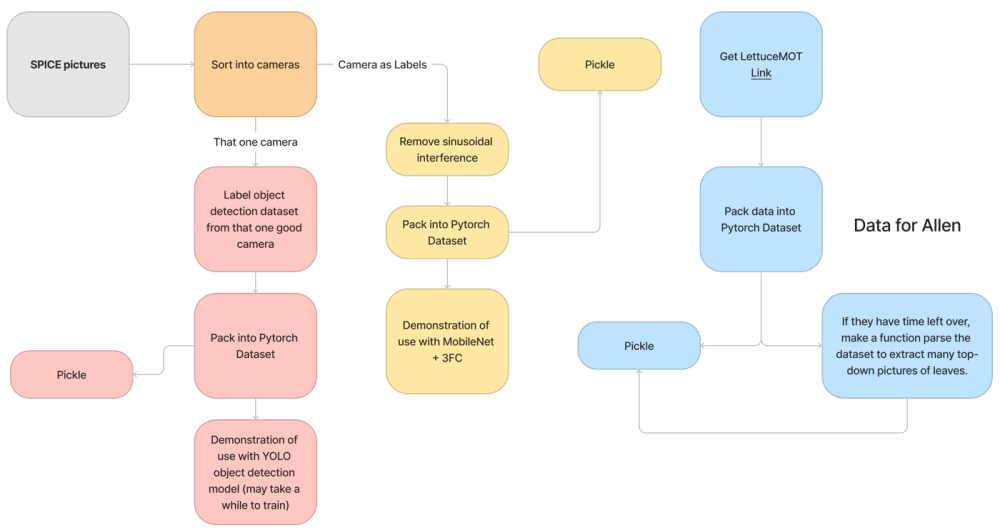
As interns, we'd like you guys to process data for | As interns, we'd like you guys to process data for testing Project 3's machine learning software. | ||
[[File:Intern Tasks.png|center|thumb|1000x1000px]] | [[File:Intern Tasks.png|center|thumb|1000x1000px]] | ||
== Creating a Pytorch Dataset == | |||
To create a Pytorch dataset from your YES/NO/MAYBE folders, use the code below. To make this work, you'll have to install [https://pytorch.org/get-started/locally/ Pytorch]. Follow the install instructions in the link.<syntaxhighlight lang="python3"> | |||
import torch | |||
import torchvision | |||
from torchvision import transforms | |||
import matplotlib.pyplot as plt | |||
import numpy as np | |||
resize_normalize = transforms.Compose([ | |||
transforms.Resize((96,96)), | |||
transforms.ToTensor(), | |||
]) | |||
SPICE = torchvision.datasets.ImageFolder('FOLDER_CONTAINING_YOUR_YES_NO_MAYBE_FOLDERS',transform=resize_normalize) | |||
plt.imshow(SPICE[0][0].permute(1,2,0)) | |||
</syntaxhighlight> | |||
== Final Repositories == | |||
Great job everyone! You can see each other's repositories down below: | |||
* [https://github.com/CookieJarGithub/RandolfPython Randolf] | |||
* [https://github.com/RandomName08/Plant-images Quentin] | |||
* Raph | |||
== Resources == | == Resources == | ||
| Line 28: | Line 73: | ||
## [https://composingprograms.com/ Composing Programs - Introduction to Programming with Python3] | ## [https://composingprograms.com/ Composing Programs - Introduction to Programming with Python3] | ||
## (Attempt) the project Euler Problems 1-5 https://projecteuler.net/archives | ## (Attempt) the project Euler Problems 1-5 https://projecteuler.net/archives | ||
# | #For editing and coding machine learning in Python (which will be useful from now on, as you use more of the packages) I recommend [https://code.visualstudio.com/ VScode] with the Jupyter extension installed, which should allow you to put "#%%" at the top of your code, press shift+enter, and run the code immediately :DD | ||
# | #[https://www.cs.toronto.edu/~guerzhoy/411/lec/W01/numpy/NumpyImgs.html On opening images with numpy, scipy and matplotlib] | ||
## | #Removing sinusoidal interference the [https://docs.opencv.org/3.4/d2/d0b/tutorial_periodic_noise_removing_filter.html Python way] | ||
##Oh no! The terms are too hard! : Fourier Transform: [https://youtu.be/spUNpyF58BY 3b1b video], [https://lpsa.swarthmore.edu/ Primer (needs calculus to understand)] | |||
##Also, if you do attempt this, ''do not hesitate to ask me questions''. | |||
Latest revision as of 09:04, 11 July 2023
Main page for distributing resource for and documenting the internship.
- June 19, 2023 - July 2023
- Meeting Schedules MWF @ 4PM
- Day 1: Initial orientation, tour- then orientation of intern tasks.
- By Friday Jun 23, 4PM:
- 2000 more pictures sorted by Friday
- Finished reading up to Ch 2.3 of the tutorial.
- By Monday Jun 26, 4PM:
- 2000 more pictures.
- Euler problems all done.
- Wed Jun 28 is a holiday. No meeting.
- By Friday Jun 28, 4PM:
- pip install matplotlib, numpy and scipy
- Look into matplotlib, numpy, scipy packages for python, show me yourself opening a picture from SPICE using matplotlib.pyplot.imshow
- Questions:
- What are the dimensions of the numpy representation of the image? Is it 1D, 2D, or 3D?
- Try to call imshow on image[0], image[1], image[2]. What appears? What do you think image[n] returns?
- Crop the 1/4 upper left, upper right, bottom left and bottom right of the image into 4 new numpy arrays. Show these images.
- By Monday July 3, 4PM:
- Create a github.com account, and create a repository creating the code you've made so far.
- By Wed July 5, 4PM:
- Download two of the folders of the LettuceMOT dataset.
- Quentin: B&F
- Randolf: O&I
- Raph: Straight1 & 2
- Inside the "gt" folder, there is a text file containing a bunch of labels. These labels are the bounding boxes of lettuce in each picture in the "img" folder. Generally, the labels are structured as follows: , is the lower left corner of the bounding box of the specific lettuce in the image, and is its width and height.
- Your task is to create a script that loops through each line in the "gt.txt" file and saves the corresponding cropped picture of a lettuce into a new folder named "cropped".
- Download two of the folders of the LettuceMOT dataset.
- By Friday, 8AM:
- Internship presentation (for debriefing meeting) (all three of you will be creating the same presentation- use google slides and collaborate to make one presentation about your results).
- Forget about the CSV thing: Make a Pytorch Dataset object out of your images. See code below for sample code opening a Pytorch dataset from a folder structure.
- Your last task: make a code showing a random image (use numpy.randint) from the dataset, and set the title to the corresponding label. Like the image provided here, but for only one image.
About CIDR Project 3
CIDR Project 3, under the larger CIDR project, focuses on the creation and evaluation of machine learning hardware and software for use in small devices. Essentially, machine learning software is too heavy to run in smaller computers, and so we focus on creating optimized software and hardware specifically for machine learning.
Your tasks
As interns, we'd like you guys to process data for testing Project 3's machine learning software.
Creating a Pytorch Dataset
To create a Pytorch dataset from your YES/NO/MAYBE folders, use the code below. To make this work, you'll have to install Pytorch. Follow the install instructions in the link.
import torch
import torchvision
from torchvision import transforms
import matplotlib.pyplot as plt
import numpy as np

resize_normalize = transforms.Compose([
            transforms.Resize((96,96)),
            transforms.ToTensor(),
        ])

SPICE = torchvision.datasets.ImageFolder('FOLDER_CONTAINING_YOUR_YES_NO_MAYBE_FOLDERS',transform=resize_normalize)

plt.imshow(SPICE[0][0].permute(1,2,0))
Final Repositories
Great job everyone! You can see each other's repositories down below:
Resources
- As some of you might not yet be familiar with Python or are a bit rusty, you should read through the following:
- Composing Programs - Introduction to Programming with Python3
- (Attempt) the project Euler Problems 1-5 https://projecteuler.net/archives
- For editing and coding machine learning in Python (which will be useful from now on, as you use more of the packages) I recommend VScode with the Jupyter extension installed, which should allow you to put "#%%" at the top of your code, press shift+enter, and run the code immediately :DD
- On opening images with numpy, scipy and matplotlib
- Removing sinusoidal interference the Python way
- Oh no! The terms are too hard! : Fourier Transform: 3b1b video, Primer (needs calculus to understand)
- Also, if you do attempt this, do not hesitate to ask me questions.


