IVerilog GTKWave Tutorial: Difference between revisions
(Created page with "## Icarus Verilog Installation On windows: Run the download executables in https://bleyer.org/icarus/ On Ubuntu: sudo apt-get install iverilog For other unix-based systems: Iverilog is available on yum, pacman and homebrew.") |
(initial commit) |
||
| Line 1: | Line 1: | ||
For those who want to do their Verilog register-transfer level (RTL) behavioral simulations offline and with a display GUI, we recommend using Icarus Verilog and GTKWave. | |||
== Installation == | |||
On | === Icarus Verilog Installation === | ||
On Windows: | |||
For other unix-based systems: | * x86-64: https://bleyer.org/icarus/iverilog-v12-20220611-x64_setup.exe | ||
Iverilog is available on yum, | * x86: https://bleyer.org/icarus/iverilog-10.0-x86_setup.exe | ||
On Ubuntu/WSL: | |||
* <code>sudo apt-get install iverilog</code> | |||
On Mac-OS: | |||
* <code>brew install icarus-verilog</code> | |||
For other unix-based systems: Iverilog is available on yum and pacman. | |||
=== GTKWave Installation === | |||
On Windows: | |||
* The above .exe installer for Icarus verilog comes with GTKWave inside the installation directory <code>/iverilog/gtkwave/bin</code>. Add this to <code>PATH</code> if you want to simply call GTKWave from the command line. | |||
On Ubuntu/WSL: | |||
* <code>sudo apt-get install gtkwave</code> | |||
On Mac-OS: | |||
* <code>brew install gtkwave</code> | |||
== Running a Verilog Behavioral Simulation == | |||
If you are here from the SEACAS 2023 simulation flow Jupyter Notebook, skip to using GTKwave to view the waveform | |||
First, create your verilog code and a verilog testbench. A sample 4-bit counter with a testbench is provided below for a quick run. | |||
==== 4-bit counter (test.v) ==== | |||
<syntaxhighlight lang="systemverilog"> | |||
module ctr( | |||
input CLK, nrst, | |||
output reg [3:0] ctr_out | |||
); | |||
reg [3:0] ctr; | |||
always@(posedge CLK) begin | |||
if (!nrst) | |||
ctr <= 0; | |||
else | |||
ctr <= ctr + 4'b1; | |||
end | |||
always@(*) | |||
ctr_out <= ctr; | |||
endmodule | |||
</syntaxhighlight> | |||
==== Testbench (tb_test.v) ==== | |||
<syntaxhighlight lang="systemverilog" line="1"> | |||
module tb_test; | |||
reg nrst,CLK; | |||
wire [3:0] c; | |||
ctr UUT(.ctr_out(c),.CLK(CLK),.nrst(nrst)); | |||
always begin | |||
#10 | |||
CLK = ~CLK; | |||
$display("out value:%b",c); | |||
end | |||
initial begin | |||
$dumpfile("test.vcd"); | |||
$dumpvars(0,tb_test); | |||
// we have to start somewhere | |||
CLK = 0; | |||
nrst = 0; | |||
#15 | |||
nrst = 1; | |||
#100 | |||
$finish; | |||
end | |||
endmodule | |||
</syntaxhighlight> | |||
=== Running iVerilog to produce the waveform outputs === | |||
On the same directory as the verilog files, run the commands below: | |||
<code>iverilog -o dsn tb_test.v test.v</code> | |||
In general, this command is structured as follows <code>iverilog -o <iverilog_output_name> <verilog_file_1> <verilog_file_2> ...</code> | |||
Then, run the simulation using vvp (which comes with iverilog) | |||
<code>vvp dsn</code> | |||
This outputs a .vcd file with the name as specified in the <code>$dumpfile("<namehere>.vcd")</code> part of the testbench. VCD stands for value change dump- it is essentially a record of how the digital waveforms change over time in your simulation. | |||
=== Viewing the output VCD using GTKWave === | |||
Run the command below to start GTKWave and have it open the VCD file: | |||
<code>gtkwave test.vcd</code> | |||
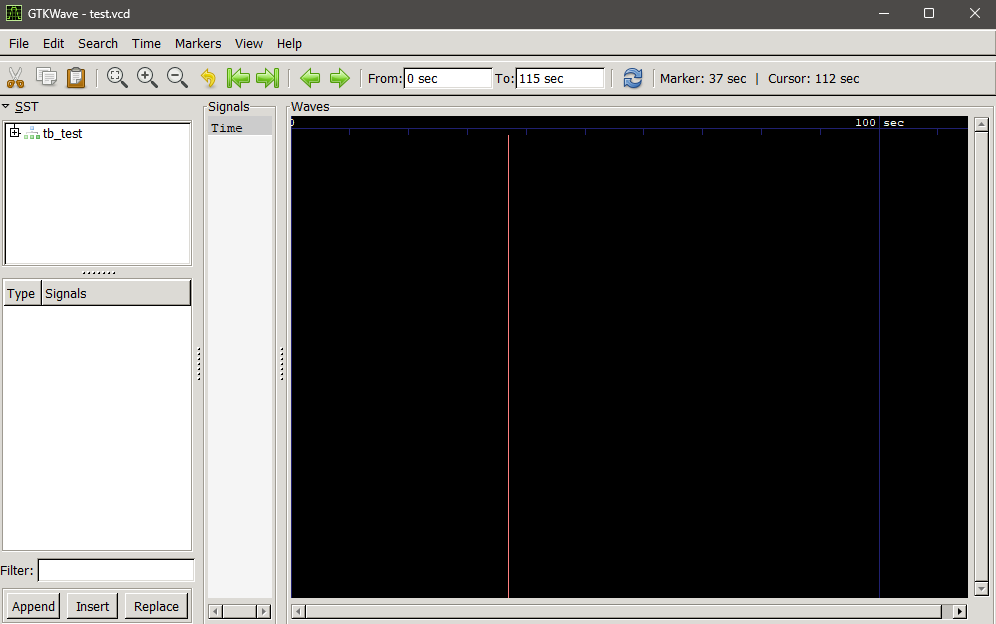
The window should open as below. | |||
[[File:GTKWave Initial Window.png|left|frame]] | |||
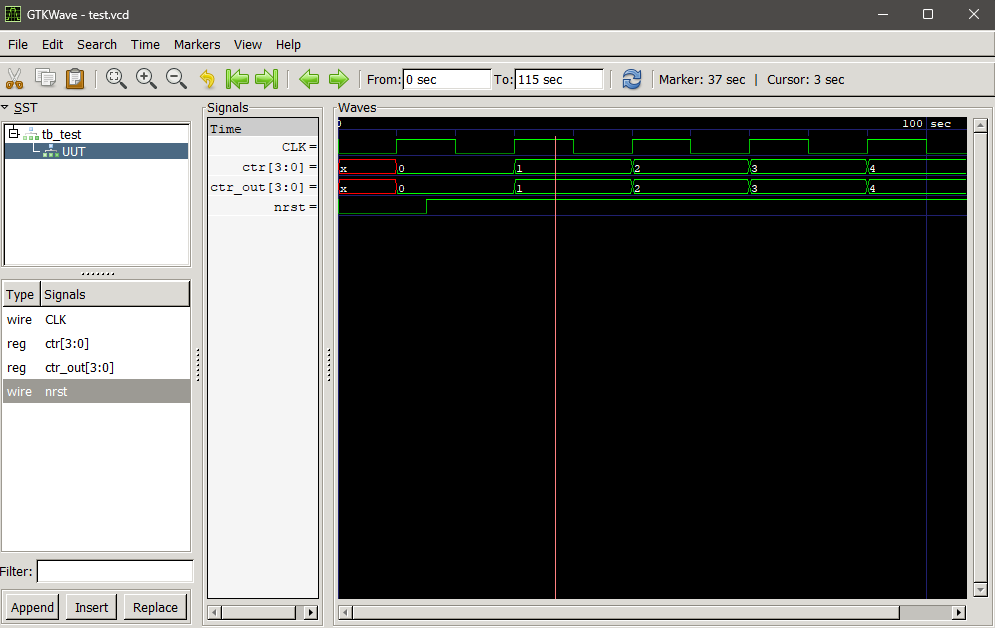
You may select signals from the left side bar as below to view them. | |||
[[File:GTKWave Choosing Outputs.png|left|frame]] | |||
Latest revision as of 12:35, 4 August 2023
For those who want to do their Verilog register-transfer level (RTL) behavioral simulations offline and with a display GUI, we recommend using Icarus Verilog and GTKWave.
Installation
Icarus Verilog Installation
On Windows:
- x86-64: https://bleyer.org/icarus/iverilog-v12-20220611-x64_setup.exe
- x86: https://bleyer.org/icarus/iverilog-10.0-x86_setup.exe
On Ubuntu/WSL:
sudo apt-get install iverilog
On Mac-OS:
brew install icarus-verilog
For other unix-based systems: Iverilog is available on yum and pacman.
GTKWave Installation
On Windows:
- The above .exe installer for Icarus verilog comes with GTKWave inside the installation directory
/iverilog/gtkwave/bin. Add this toPATHif you want to simply call GTKWave from the command line.
On Ubuntu/WSL:
sudo apt-get install gtkwave
On Mac-OS:
brew install gtkwave
Running a Verilog Behavioral Simulation
If you are here from the SEACAS 2023 simulation flow Jupyter Notebook, skip to using GTKwave to view the waveform
First, create your verilog code and a verilog testbench. A sample 4-bit counter with a testbench is provided below for a quick run.
4-bit counter (test.v)
module ctr(
    input CLK, nrst,
    output reg [3:0] ctr_out
);

reg [3:0] ctr;

always@(posedge CLK) begin
    if (!nrst)
        ctr <= 0;
    else
        ctr <= ctr + 4'b1;
end

always@(*)
    ctr_out <= ctr;

endmodule
Testbench (tb_test.v)
 1 module tb_test;
 2
 3 reg nrst,CLK;
 4 wire [3:0] c;
 5
 6 ctr UUT(.ctr_out(c),.CLK(CLK),.nrst(nrst));
 7
 8 always begin
 9     #10
10     CLK = ~CLK;
11     $display("out value:%b",c);
12 end
13
14 initial begin
15 $dumpfile("test.vcd");
16 $dumpvars(0,tb_test);
17
18 // we have to start somewhere
19 CLK = 0;
20 nrst = 0;
21
22 #15
23 nrst = 1;
24
25 #100
26
27 $finish;
28 end
29
30 endmodule
Running iVerilog to produce the waveform outputs
On the same directory as the verilog files, run the commands below:
iverilog -o dsn tb_test.v test.v
In general, this command is structured as follows iverilog -o <iverilog_output_name> <verilog_file_1> <verilog_file_2> ...
Then, run the simulation using vvp (which comes with iverilog)
vvp dsn
This outputs a .vcd file with the name as specified in the $dumpfile("<namehere>.vcd") part of the testbench. VCD stands for value change dump- it is essentially a record of how the digital waveforms change over time in your simulation.
Viewing the output VCD using GTKWave
Run the command below to start GTKWave and have it open the VCD file:
gtkwave test.vcd
The window should open as below.
You may select signals from the left side bar as below to view them.

