Installing XSCHEM: Difference between revisions
No edit summary |
|||
| Line 23: | Line 23: | ||
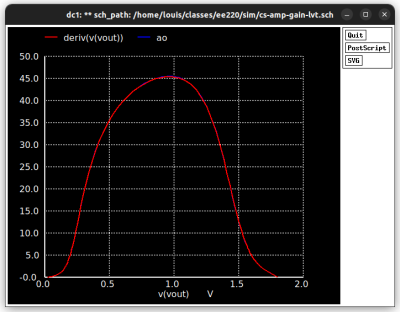
| [[File:Cs-amp-gain.png|thumb|400px|Figure 3: CS amplifier small-signal gain.]] | | [[File:Cs-amp-gain.png|thumb|400px|Figure 3: CS amplifier small-signal gain.]] | ||
|- | |- | ||
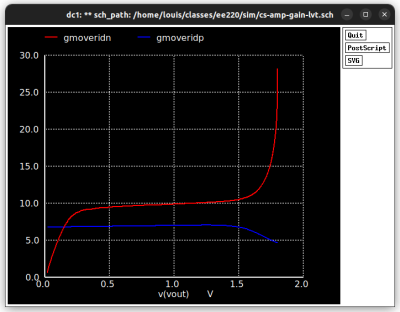
| [[File:Cs-amp-gmoverid.png|thumb|400px|Figure 4: CS amplifier <math>\tfrac{g_m}{I_D}</math>.]] | |||
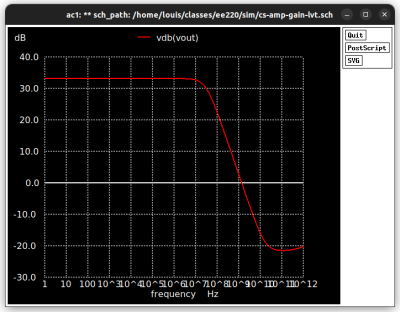
| [[File:Cs-amp-freq-resp.png|thumb|400px|Figure 5: CS amplifier frequency (magnitude) response.]] | |||
|- | |||
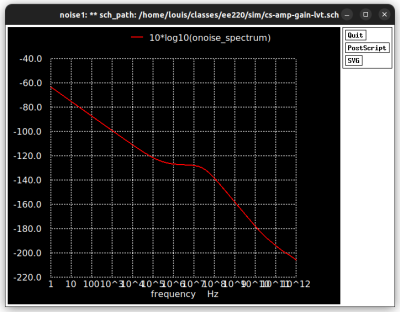
| [[File:Cs-amp-output-noise.png|thumb|400px|Figure 6: CS amplifier output noise power spectral density.]] | |||
| | |||
|} | |} | ||
Revision as of 16:26, 28 July 2022
XSCHEM is a schematic capture program that allows to interactively enter an electronic circuit using a graphical interface. When the schematic has been created a circuit netlist can be generated for simulation.
Installation
You can install XSCHEM via git using:
$ git clone https://github.com/StefanSchippers/xschem
The XSCHEM documentation is here.
Using XSCHEM with the SkyWater 130nm PDK
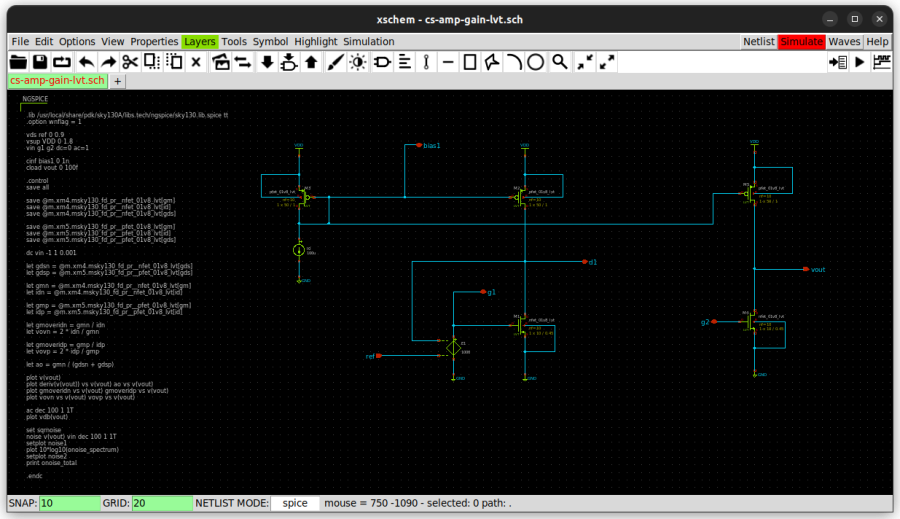
To test your XSCHEM installation, you can use this sample schematic of a common-source amplifier, with the (1) test voltages and load capacitors, and (2) the simulation analyses added added as NGSPICE code. A screenshot of the schematic is shown in Fig. 1.
To run the simulation, first click on the Netlist tab located at the upper right corner of the XSCHEM window, then click on the Simulate tab. This will call NGSPICE, and will run the simulation. Note that this assumes you have setup NGSPICE, XSCHEM, and the SkyWater 130nm design kit using the default file locations.
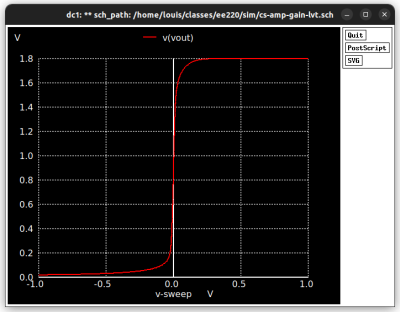
Once the simulation completes, you will get plots for the common-source amplifier transfer characteristic, low frequency gain as a function of output swing, the power efficiency metric , the frequency response, and the output noise power spectral density, as shown in Figs. 2-6.
